Power BI
Budget Variance Dashboard
This is a PowerBI visual I created with a focus on Budget Monitoring. As a Budget Manager this is by far the dashboard I use the most. There is a way to view budget variance by the budget year, by the current FY months, and year to date. We used to look at all of this line by line with lots of data to keep straight, now we can visualize it.
(Hint: Use the slicers to change selections. Some of these will filter others. You can select multiple by holding down the ctrl key while clicking.)
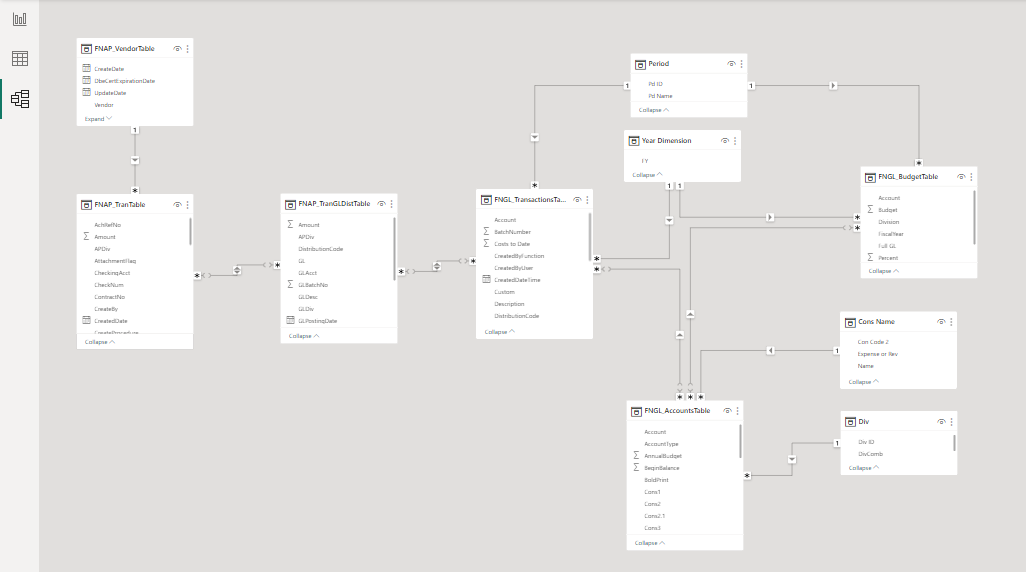
This visual also has a cool backend to it. I was able to source the data directly from my works ERP Database. All the data updates automatically with a set refresh schedule! What you're seeing embedded on the webpage should be live! Below is a picture of the model view showing all the relationships I had to create to get the database data to talk. I couldn't get the Entity Relationship Diagram (ERD) from our IT guys... So I did a lot of trial and error until it all matched our old reports. ¯\_(ツ)_/¯